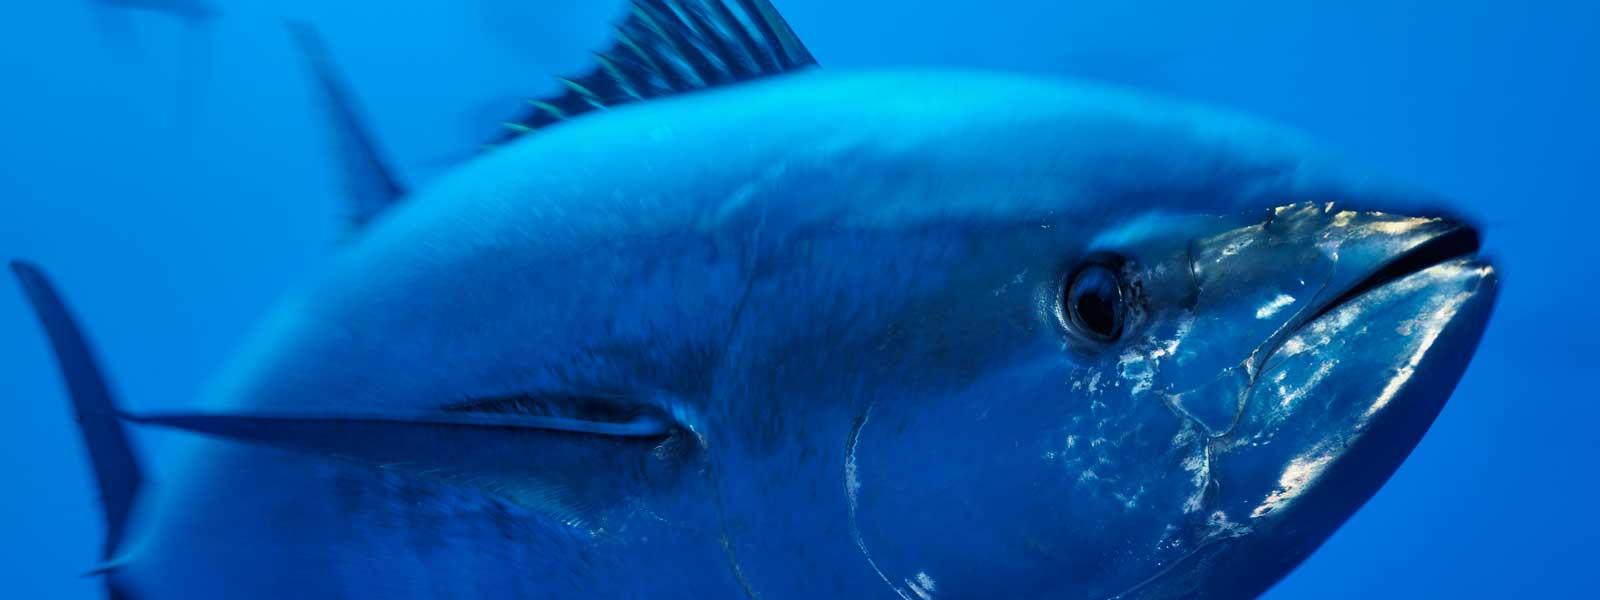
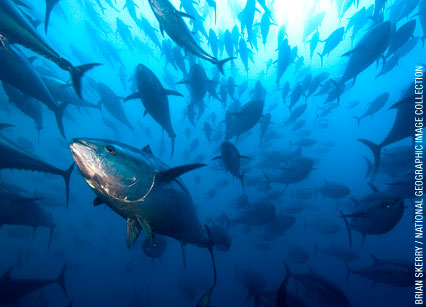
Tuesday, October 17, 2017

Giant Bluefin

There are few things more spectacular in the ocean than the giant bluefin tuna, Thunnus thynnus.  Check out the tag-a-giant program to learn more about their conservation, range, and how you can participate.  Make sure to look at the conservation section, and particularly the stock size of the western Atlantic population.

Monday, October 16, 2017

Blue Fin Tuna Assignment

If you didn't think the natural world was cool enough already, watch Barbara Block's Technology, Entertainment, Design (TED) talk.  Twenty minutes of awesomeness that gives you a good overview of the science of managing fish in the ocean, and the innovation that goes into figuring out how these animals make a living.  One thing to keep in mind is that their project is designed to give us a better understanding of the niche of the organism, in addition to the population biology.  Something that we'll be talking about in the future.  Oh, and don't miss the remote sensing aspect here either.  We have satellite imagery of the ocean, as well as data collected by our autonomous agents: fish, seals, and birds.  Make sure to check out the Tagging of Pacific Predators program as well.

Sunday, October 15, 2017

Modeling avian flu


Here is a link to a web page on preventing an Avian Flu pandemic, with a good overview and news release on the study here. Make sure to watch the videos at the bottom of the page of the spread of the outbreak taken from the supercomputer simulations.
We're working toward this kind of model in class.

Thursday, October 23, 2014

Population Pyramids


Hey guys,

Population growth is pretty big business. Not only do we manage wild populations with it, or make a killing on forestry projects, or fisheries, or figure out how to stop the spread of epidemic disease--we're interested in how many of us there are going to be in the future. The US Census Bureau has a great page on looking at populations in terms of age and sex--population pyramids-- for all the countries of the world. We'll be going over these in class.

Gold Mining Deforestation in Peru


Hey guys, here is the video of the overflight of the gold rush in Madre de Dios, Peru.  The narrator is a famous Peruvian journalist and if you speak Spanish, what he says is moving.  If you don't, well, the video speaks for itself.

Monday, October 13, 2014

Bird migration using radar

Hey guys, you all know that birds fly south in the fall. Ornithologists use the NEXRAD radar system--the same Doppler radar we use to track storms--to track birds. Check out this page from Ohio State. You can check out both the number of birds in the air as well as their direction and velocity all across the US here. (Cycle through topics at the bottom of the page.) Make sure to check out some of the rest of the pages at Gauthreaux's site as well.


How cool is that?

More sites:

Background on migration. Site for the super-cool loop of migrating birds.

Tuesday, December 03, 2013

Climate Visualizations


Here is a link to that amazing JPL global aerosol visualization we saw in class today.  Pure awesomeness.

There are a lot of other great resources on the web that can help you understand climate.  Going straight to the sources of data, such as the Tropical Rainfall Monitoring Mission (TRMM) site is a great way to find data. [Note: loop this animation and  groove deeply on the annual cycle in precipitation--where is the ITCZ?  The monsoons?  Why is it raining over the Gulf Stream?  Where isn't it raining?]

NASA has focused a lot of effort on explaining the earth system, and they have dynamite overviews of things like radiation balance, aerosols, biogeochemical cycles, etc., at their website:
http://earthobservatory.nasa.gov/Features/ .  (My lab had a hand in the Seeing the Forest for the Trees feature on forest carbon through our collaboration with Sassan Saatchi at JPL/CalTech.).  Or, go straight to the good stuff by looking at the figures generated from remotely sensed data. These are excellent visualizations of most of the climate parameters that we have talked about in class.You can get lost in these figures, and there are some great animations as well.  

Tuesday, November 19, 2013

Global Deforestation Mapping

This last week one of the most impressive landscape mapping efforts ever undertaken came out. Check out this link to a global deforestation map.  The summary of the paper in Science:

Forests worldwide are in a state of flux, with accelerating losses in some regions and gains in others. Hansen et al. (p. 850) examined global Landsat data at a 30-meter spatial resolution to characterize forest extent, loss, and gain from 2000 to 2012. Globally, 2.3 million square kilometers of forest were lost during the 12-year study period and 0.8 million square kilometers of new forest were gained. The tropics exhibited both the greatest losses and the greatest gains (through regrowth and plantation), with losses outstripping gains.


Here is a link to the original paper.

Saturday, December 08, 2012

Nature's Zombies

In class we saw examples of how parasites can take control of host behavior through altering their brains and nervous systems. This is cool in its own right, and also offers a way to think of entirely new classes of drugs for helping with intractable mental disorders.  Welcome to the field of neuro parasitology.  Check out this freak show of an article.

Wednesday, November 28, 2012

Pollination is beautiful

When you are in the depths of despair over life history evolution or models of species interactions, it always helps to take a minute to step back and understand why we have a course called BIO113.  This, my friends, will give you a good idea.  A beautiful and sparse visual summary of all that we study in ecology. Some of the most stunning footage of pollination that I have ever seen.

It is images like these, and the understanding of all the complexities and science behind them, that I hope you carry forward with you when think back about what you learned in BIO113. 


PS. If you want to see the cinematographer give an introduction, it is here: http://www.ted.com/talks/louie_schwartzberg_the_hidden_beauty_of_pollination.html

So much cool data...

Hey guys,

Now is the time in the class where we move into understanding our world at large spatial scales, and that means lots of remotely sensed data.  If you want to have an awesome perspective on things, check out the NASA Earth Observatory site, particularly the animations in the global maps.   Not enough, you say?

http://earthguide.ucsd.edu/earthguide/diagrams/energybalance/index.html

http://earthguide.ucsd.edu/

Thursday, November 08, 2012

Sandy and Environmental Stochasticity

In class we've talked about environmental stochasticity and population growth rate--the random fluctuations in environment that can affect births and deaths.  Hurricane Sandy was one of those events.  If you're a Eastern Towhee living in New Jersey coastal scrub, it's going to be a bad year.  Check out these visualizations of changes along the Jersey coast.

Monday, November 23, 2009

Milankovitch and Climate Resources


One of the great theories in the study of paleoclimate is that changes in Earth's orbital parameters act as forcings that change climate over long periods of time.  We covered these Milankovitch Cycles in class and I thought  you'd enjoy this interactive animation of the Milankovitch Cycles so you can see its effects.

Also, Dr. Nolan Atkins has a great meteorology course online that has excellent references and illustrated lecture notes on paleoclimate, and also on the basic climate of the Earth. It is a great supplement to lecture!

Tuesday, November 17, 2009

Commensalism in action

Hey guys,

Check out these videos of commensalism in action:


We see this in Peru and Galapagos:

Monday, November 16, 2009

Remote Sensing and GIS Lab


This week’s lab is posted directly on the blog. Follow the instructions in the lab. Along the way you’ll see links that define words and/or take you to sites that you need to complete the lab. Click on the links and explore. If you don’t know a word and it isn’t defined below, Google it. The world is a big place, and this lab is designed to give you the tools to look at it as a whole. Enjoy!


Conservation Biology: Using GIS and Remote Sensing to Understand Deforestation of Biodiversity Hotspots


Goals for this lab:


1. Learn to use Google Earth, a sophisticated yet easy tool for remote sensing and communicating results.


2. Identify biodiversity hotspots and analyze threats to tropical forests.


3. Make a short presentation on the threats to the biodiversity hotspot of your choice.


4. Communicate your results to the wider world through your TA.


5. Get a broader picture of the world we live in, the stage for the entire drama of life.


Introduction
It seems like every day in the news you hear something about large-scale changes in the Earth system.  Global temperature or precipitation is changing, CO2 emissions are increasing in different parts of the world (display US data by state in Google Earth), sea ice in the Arctic Ocean is at a minimum, glaciers and ice sheets are receding, forest fires and deforestation are occuring throughout wide areas of the tropics, or that ocean temperatures and chlorophyll content are changing in parts of the Pacific.  One question that should run though your mind is, "how do we even know that these things that happen on such vast spatial scales are happening, and how do we measure them?"
Ecologists and conservation biologists are interested in ecological and evolutionary processes that occur on large spatial and temporal scales as well. Two of the tools we use to look at these are called Geographical Information Systems (GIS) and Remote Sensing. We’re the first generation that has access to tools that lets us monitor the entire globe–from ocean temperatures to cloud cover to terrestrial and oceanic primary productivity to forest cover change–and use these tools to answer scientific questions. Today we’re going to use these tools to look at forest cover and patterns and causes of land–use change in the areas that have the highest biological diversity on the planet, place that scientists have termed Biodiversity Hotspots or just plain Hotspots. You’ll use these links for a large part of the lab today.
Democratization of Remote Sensing and GIS: Google Earth
GIS and RS used to be the realm of a techno-shaman like Sassan Saatchi at the Jet Propulsion Laboratory in Pasadena. (His work on African and Neotropical forests is amazing.) Not anymore. The free version of Google Earth (GE) available online has democratized remote sensing and GIS so that even first-timers can ask global-scale questions about remotely sensed data, then archive the data in ways that communicate their observations and findings to others. For example, the global spread of swine flu (H1N1) is being monitored using Google Earth, and GE is also used to aid in natural disasters, such as the the earthquake relief effort in Pakistan in 2005. Many of the data we'll use for the rest of the course are available in Google Earth too (some land and ocean data here)--it is an excellent resource for Earth Science.  Download Google Earth and set it up on your computer. There is a great blog that you can use to see some of the uses of Google Earth, and the blog also has tips about setting up Google Earth for maximum utility.

Exercise 1: Getting Started with Google Earth
In this section you will

  • Learn how to use the basic controls of Google Earth
  • Dowload a file that guides you to places on the earth
  • Learn how to create and save files to your computer
  • Learn about the basic kinds of satellite platforms and their capabilities
What you see at first is a picture of the entire earth. Try grabbing the globe with the cursor and moving it around. Look at the product tour for Google Earth to familiarize yourself with the controls. Use the “zoom” button to get closer to the globe. On the control bar you can see the equivalent “altitude” that you are looking at the earth from. Check this frequently so you can keep an idea of the scale of the features you are looking at. Turn the 3-d view by going to "tools --> options" and then checking the “terrain” box.  Try tilting the view and flying across the landscape--definitely check out the mountains. You can turn off the latitude and longitude grids by hitting Ctrl+L, or going to the view menu. Make sure you know what latitude and longitude tell you!
Two things you’ll need to do today are not covered in the tour: 1) save what you are looking at, and 2) make and annotate placemarks. You make and save pictures of whatever you’re looking at on the screen by choosing File and then Save Image (or just hit Ctrl+S). You can put these pictures into Powerpoint and use them to illustrate points about deforestation and land cover. To put a placemark anywhere on the globe, first find the location where you want to place it. Then in the menu, go to Add and choose Placemark (or just hit Ctrl+N). A dialog box will pop up where you can type in information about what you are seeing, measurements you have taken, observations, notes, and even links to web sites. On the left side of the dialog box will be a place where you can click “New Folder”. Do that and label it “Mybio113” or something like that. When you click OK, the placemark is put down on the location you chose, and the information linked to it is put into the new folder you just made. If you need to move a placemark, just double click on it, then drag it to a new position. Single placemarks, or your entire placemark folder can be saved by putting the cursor over the folder and right clicking. You'll be making a file that ends with .kmz, and you can share that with other people. Choose Save As to put a copy in another folder on your computer, or Email to email the placemark folder to your TA. To see an example of what you can do, check out Dr. Silman's Fire Scouting trip in the high Andes.

We’ve made a file for you that has several placemarks in it. Download the file and double click it. This places a folder named “Bio113” under your “temporary places” dialog in the places box. Open the folder and click on Bio 113 Lab.
Next, find your house, make a placemark on it, and save it to your placemark folder. What is the latitude and longitude of your house? What is it for your neighbor’s house? (Note, wherever you put the cursor, Google Earth gives you latitude and longitude.) You'll see that there are two different resolutions in the images. LANDSAT images have a resolution of 30m. High resolution images are usually from the Ikonos or Quickbird satellites, which have resolutions of 1m and 60 cm! These let you see individual tree crowns, lines on roads, and even people!  These satellites are just a couple of the myriad sensors that we have to look at the earth, each of which is designed to look at different aspects of the earth system.

Go see Paris, or the Pyramids at GizaEgypt. Fly into the site of the new Wake Forest Marine program at Lighthouse Reef atoll, Belize. (Use the search dialog box.) Annotate your placemarks, and make a web link to something interesting and put that in the annotations. Open any folder on your computer and type "\\Acfiles\www-home" in the address bar. This is your Deacon On-Line Directory. When you save a file here, the file will have the web address "http://www.wfu.edu/~yourusername/filename.extension". Link the file to your blog and publish your post. Now it is online!


In this section you will

  • Learn about the basic kinds of deforestation as they appear from space
  • Dowload and examine imagery that shows a time-series of deforestation in the Amazon Basin
  • Calculate deforestation rates in tropical rain forest
Deforestation is a significant threat to biodiversity and adds more CO2 to the atmosphere each year than all transportation on earth combined.  How do we know this?  Remote sensing is a powerful tool for looking at the land cover change and turning that into data we can use to answer important questions on large scale patterns and processes in the earth system. Check out NASA's excellent site and familiarize yourself with the different kinds of patterns and how we detect them.  This KMZ file on global deforestation is an overview of deforestation rates for each country on earth. The remote sensing tutorial has a page showing the various patterns and extent of deforestation too (look halfway down page). Here is a great view of deforestation in Bolivia. Now look at the area around Manaus, Brazil. (Note the different resultions of images in your view.) Download the LANDSAT time series overlay and wait for it to load. Go to the Google Earth Temporary Places folder and un-check the 1987 folder to see the change in deforestation between 1987 and 2001. You can compare the deforestation between 2001 and today by turning the 2001 image off, and also by turning the 2001 image off and looking at the current (2008) image of Manaus.  The resultion of the 2008 image is higher, and it is from a different sensor, but you can still see the patterns of deforestation.  Now, was deforestation greater in the period 1987-2001, or 2001-2008?  What might affect deforestation rates?
Your TA will help each group in the lab select one of the sites placemarked in the Bio113 folder. Go to the placemark that you have been assigned, and familiarize yourself with the geography of your area. Look at the site. What are the defining features of your site? What is unique about it? How can you recognize different kinds of farm fields, plantations, and settled areas?

Next, determine what type or pattern of deforestation is shown. What are the general causes of deforestation there? What are the patterns of deforestation? Is it large scale, or small scale? Is it centered near large settled areas, or evenly distributed? Look for the causes of deforestation at your site on the web. What is the deforestation rate (you can find this information on the appended web sites)?
Next, we'll use Google Earth (GE) to measure the amount of deforestation in your area.  First, using the path tool in GE, draw a path around the deforested areas in your image.  Second, right click on the new path and save it on your desktop.  Below the file name click the extension "kml" instead of the default "kmz." Next download the program GE Path.  Save the latest version to your c:\temp directory, unzip the file, and then run the setup.  GE Path takes the path files that you save in Google Earth and will tell you all sorts of information about them.  IN this case you will be using the information about the area of the deforested region.  Once you have downloaded and installed the program, open it. Go to the file menu and choose your kml file.   In the bottom section called Area/Perimeter, check the "area" box, and just below that choose the method, "large area."  Finally, to get the measurement, choose the "Run" menu at the top.  The area in km2 should appear in the box next to "area."  Does your measurement come close to the published value for your site?
After about 10 minutes, you should be able to recognize the major features shown by your site. When everyone has finished working, each goup in the class will have 5 minutes to demonstrate the features of their assigned site to the class, using a computer connected to a video projector. The easiest thing to do is to put the information on your blog and let your classmates see it while you tell them about it.
Exercise 3: Deforestation Patterns & Conservation Issues in Biodiversity Hotspots
In this section you will

  • Study one of Earth's biodiversity hotspots in more depth
  • Share information with you classmates via the internet
Now, go to the Biodiversity Hotspot home page. Your TA will help you select one Biodiversity Hotspot Region to work on.  Here is a Google Earth KMZ file that has all of Earth's hotspots plus information on them. Your task for the rest of the lab is to put together a brief visual summary report of the site, using annotated placemarks in Google Earth. Your report should be built around a placemark or group of placemarks in the same Google Earth folder showing the site’s location. (Hint, if you right click on the folder that contains the placemarks it makes one Google Earth file with all the placemarks in it.) Links to that placemark on your blog should show or include:
  • The topography of the site.
  • Remote Sensing images that highlight the site’s problems or threats.
  • Images of the biodiversity and/or major threatened species.
  • Rate and type of destruction.
  • Current efforts to protect the site.
In the last hour of lab, each group will present a short oral report on their site for the class using Google Earth.


Useful Resources
General information on the status of rain forest conservation with country summaries:http://rainforests.mongabay.com/
Deforestation rates: http://www.mongabay.com/deforestation_tropical.htm
A general article about why forests are being destroyed: http://www.mongabay.com/0801.htm
Information on oil palm plantations, a particularly threatening practice in Indonesia andMalaysia.

Tuesday, November 03, 2009

Marvelous!


Hey guys, the bird diversity in the Andes and Amazon is the highest on the planet.  One of the most interesting birds in the Andes is the Marvelous Spatuletail, a hummingbird.  Check out what sexual selection has wrought.  One of nature's wonders, the mating display has been filmed for the first time.  Enjoy!

Note: More footage here

Tuesday, October 27, 2009

Dynamic Population Pyramids


Hey guys, you can find the demographic data for any country around the world at the US Census Bureau International Data Base.  If you're hungry for more data, check out the Wikipedia page on World Population--it's a gold mine of information and links.

Monday, October 26, 2009

Marking and Recapturing Tuna


Here is a link to Barbara Block's Giant Bluefin Tuna project. Most of which happens here in North Carolina starting about a month from now. Check out all the cool data and ways that the track and mark fish!

Thursday, October 22, 2009

Assimiwhosawhata?

Hey guys,

Someone came up to me after lecture and said that they had never heard of some of the plant terms used, so I thought I would send you the link to a page on photosynthesis that talks in more detail about what we covered in class in the first lecture. There is also a lot of great stuff in your text, including some animations and figures. The general chapter for photosynthesis is chapter 8.

Will it be on the test? Just what we covered in class. The text will help you understand what we talked about, and will give you access to more information on the subject.

Tuesday, December 11, 2007

Snap!

Oh no they didn't...check out this super-cool study about mitigating the effects of CO2 increases in the atmosphere. These guys take a cool twist on the....yes....long term carbon cycle, taking acid from the ocean and weathering silicate rocks.

Jerboa is way too cool!


Hey guys, check out this article on a mammal from the Gobi Desert that has proved elusive to scientists. You can see video footage of it at this site. Too cool.

Sunday, November 25, 2007

Remote Sensing Lab: Deforestation and Google Earth

This week’s lab is posted directly on the blog. Follow the instructions in the lab. Along the way you’ll see links that define words and/or take you to sites that you need to complete the lab. Click on the links and explore. If you don’t know a word and it isn’t defined below, Google it. The world is a big place, and this lab is designed to give you the tools to look at it as a whole. Enjoy!


Conservation Biology: Using GIS and Remote Sensing to Understand Deforestation of Biodiversity Hotspots


Goals for this lab:

1. Learn to use Google Earth, a sophisticated yet easy tool for remote sensing and communicating results.

2. Identify biodiversity hotspots and analyze threats to tropical forests.

3. Make a short presentation on the threats to the biodiversity hotspot of your choice.

4. Communicate your results to the wider world either through posting it directly on your blog, or through your TA.

5. Get a broader picture of the world we live in, the stage for the entire drama of life.

Introduction

It seems like every day in the news you hear something about large-scale changes in the Earth system.  Sea ice in the Arctic Ocean is at a minimum, glaciers and ice sheets are receding, forest fires and deforestation are occuring throughout wide areas of the tropics, ocean temperatures are changing in parts of the Pacific.  One question that should run though your mind is, "how do we even know that these things that happen on such vast spatial scales are happening, and how do we measure them?"

Ecologists and conservation biologists are interested in ecological and evolutionary processes that occur on large spatial and temporal scales as well. Two of the tools we use to look at these are called Geographical Information Systems (GIS) and Remote Sensing. We’re the first generation that has access to tools that lets us monitor the entire globe–from ocean temperatures to cloud cover to terrestrial and oceanic primary productivity to forest cover change–and use these tools to answer scientific questions. Today we’re going to use these tools to look at forest cover and patterns and causes of land–use change in the areas that have the highest biological diversity on the planet, place that scientists have termed Biodiversity Hotspots or just plain Hotspots. You’ll use these links for a large part of the lab today.

Democratization of Remote Sensing and GIS: Google Earth

GIS and RS used to be the realm of a techno-shaman like Sassan Saatchi at the Jet Propulsion Laboratory in Pasadena. (His work on African and Neotropical forests is amazing.) Not anymore. The free version of Google Earth (GE) available online has democratized remote sensing and GIS so that even first-timers can ask global-scale questions about remotely sensed data, then archive the data in ways that communicate their observations and findings to others. For example, the global spread of avian flu is being monitored using Google Earth, and GE is also being used to aid the earthquake relief effort in Pakistan. Download Google Earth and set it up on your computer. There is a great blog that you can use to see some of the uses of Google Earth, and the blog also has tips about setting up Google Earth for maximum utility.

Exercise 1: Getting Started with Google Earth

What you see at first is a picture of the entire earth. Try grabbing the globe with the cursor and moving it around. Look at the product tour for Google Earth to familiarize yourself with the controls. Use the “zoom” button to get closer to the globe. On the control bar you can see the equivalent “altitude” that you are looking at the earth from. Check this frequently so you can keep an idea of the scale of the features you are looking at. Turn on the “terrain” layer (make sure the box is checked) and try tilting the view and flying across the landscape--definitely check out the mountains. You can turn off the latitude and longitude grids by hitting Ctrl+L, or going to the view menu. Make sure you know what latitude and longitude tell you!

Two things you’ll need to do today are not covered in the tour: 1) how to save what you are looking at, and 2) making and annotating placemarks. You make and save pictures of whatever you’re looking at on the screen by choosing File and then Save Image (or just hit Ctrl+S). You can put these pictures into Powerpoint or on your own blog, and use them to illustrate points about deforestation and land cover. To put a placemark anywhere on the globe, first find the location where you want to place it. Then in the menu, go to Add and choose Placemark (or just hit Ctrl+N). A dialog box will pop up where you can type in information about what you are seeing, measurements you have taken, observations, notes, and even links to web sites. On the left side of the dialog box will be a place where you can click “New Folder”. Do that and label it “Mybio113” or something like that. When you click OK, the placemark is put down on the location you chose, and the information linked to it is put into the new folder you just made. If you need to move a placemark, just double click on it, then drag it to a new position. Single placemarks, or your entire placemark folder can be saved by putting the cursor over the folder and right clicking. You'll be making a file that ends with .kmz, and you can share that with other people. Choose Save As to put a copy in another folder on your computer, or Email to email the placemark folder to your TA. To see an example of what you can do, check out Dr. Silman's Fire Scouting trip in the high Andes.

We’ve made a file for you that has several placemarks in it. Download the file and double click it. This places a folder named “Bio113” under your “temporary places” dialog in the places box. Open the folder and click on Busch Stadium.

Next, find your house, make a placemark on it, and save it to your placemark folder. What is the latitude and longitude of your house? What is it for your neighbor’s house? (Note, wherever you put the cursor, Google Earth gives you latitude and longitude.) You'll see that there are two different resolutions in the images. LANDSAT images have a resolution of 30m. High resolution images are usually from the Ikonos or Quickbird satellites, which have resolutions of 1m and 60 cm! These let you see individual tree crowns, lines on roads, and even people!

Go see Paris, or the Pyramids at Giza, Egypt. Fly into Almaty, Khazakstan, home of Borat, at 20,000’. (Use the search dialog box.) Annotate your placemarks, and make a web link to something interesting and put that in the annotations. Open any folder on your computer and type "\\Acfiles\www-home" in the address bar. This is your Deacon On-Line Directory. When you save a file here, the file will have the web address "http://www.wfu.edu/~yourusername/filename.extension". Link the file to your blog and publish your post. Now it is online!

Exercise 2: Identifying Deforestation Patterns in Biodiversity Hotspots

Deforestation is a significant threat to biodiversity and remote sensing is a powerful tool for looking at the land cover change. Check out NASA's excellent site and familiarize yourself with the different kinds of patterns and how we detect them. The remote sensing tutorial has a page showing the various patterns and extent of deforestation too (look halfway down page). Here is a great view of deforestation in Bolivia. Now look at the area around Manaus, Brazil. (Note the different resultions of images in your view.) Download the LANDSAT time series overlay and wait for it to load. Go to the Google Earth Temporary Places folder and un-check the 1987 folder to see the change in deforestation between 1987 and 2001. You can compare the deforestation between 2001 and today by turning the 2001 image off. Try downloading the United Nations Educational, Scientific and Cultural Organization's World Patrimony sites and have a look around.

Your TA will help each group in the lab select one of the sites placemarked in the Bio113 folder. Go to the placemark that you have been assigned, and familiarize yourself with the geography of your area. Look at the site. What are the defining features of your site? What is unique about it? How can you recognize different kinds of farm fields, plantations, and settled areas?

Next, determine what type or pattern of deforestation is shown. What are the general causes of deforestation there? What are the patterns of deforestation? Is it large scale, or small scale? Is it centered near large settled areas, or evenly distributed? Look for the causes of deforestation at your site on the web. What is the deforestation rate (you can find this information on the appended web sites)?

Now using the Measure tool, determine how much area is deforested in the photo using Google Earth. Does your measurement come close to the published value for your site?

After about 10 minutes, you should be able to recognize the major features shown by your site. When everyone has finished working, each goup in the class will have 5 minutes to demonstrate the features of their assigned site to the class, using a computer connected to a video projector. The easiest thing to do is to put the information on your blog and let your classmates see it while you tell them about it.

Exercise 3: Deforestation Patterns & Conservation Issues in Biodiversity Hotspots

Now, go to the Biodiversity Hotspot home page. Your TA will help you select one Biodiversity Hotspot Region to work on. Your task for the rest of the lab is to put together a brief visual summary report of the site, using annotated placemarks in Google Earth. Your report should be built around a placemark or group of placemarks in the same Google Earth folder showing the site’s location. (Hint, if you right click on the folder that contains the placemarks it makes one Google Earth file with all the placemarks in it.) Links to that placemark on your blog should show or include:

  • The topography of the site.
  • RS images that highlight the site’s problems or threats.
  • Images of the biodiversity and/or major threatened species.
  • Rate and type of destruction.
  • Current efforts to protect the site.

In the last hour of lab, each group will present a short oral report on their site for the class using Google Earth.

Homework: Publishing Your Findings Online

After lab, but before the last day of class for the semester, every lab group must post their placemarks folder (the one containing the KMZ file) to their blog, which will also be linked to the Ecology and Evolution Blog, so that others can view their reports.


Useful Resources

General information on the status of rain forest conservation with country summaries: http://rainforests.mongabay.com/

Deforestation rates: http://www.mongabay.com/deforestation_tropical.htm

A general article about why forests are being destroyed: http://www.mongabay.com/0801.htm

Here is an article from WWF on deforestation in Borneo.

Good information on conservation issues in the world’s rain forests.

Information on oil palm plantations, a particularly threatening practice in Indonesia and Malaysia.

Wednesday, November 21, 2007

Termite Metagenomics


So, you eat turkey, and termites eat wood. Turkey, even the dry stuff made by your great-aunt, is easy to digest. (To see who is helping you out, check this post.) Wood is much, much tougher. Well, today's issue of Nature has the 411 on the termite's gut-posse. Hundreds of species of bacteria doing incredible feats of metabolic biochemistry--an ecosystem of mutualists as we talked about in class!

Monday, November 19, 2007

Yes, he was working...


Hey guys, I thought you might get a kick out of this picture of Dr. Anderson in the field down in Galapagos. Keepin' it real with his peeps.....

Thursday, November 01, 2007

Mind the Gapminder!

Hey guys, here is a link to Gapminder, which looks at demographic trends in relation to wealth and other social factors. Definitely take a look and play around with it.

Thursday, October 26, 2006

Population pyramids and global population density

Hey guys, here is the link to the cool population pyramids we looked at in class this week. And, for cool looks at population density all over the planet, check out the Gridded Population of the World site at Columbia University.

Tuesday, December 06, 2005

Growing trees increases global warming?

Hey guys, I thought you'd find this article about how reforestation in the temperate zone can actually increase global warming. How, you ask? Albedo. It reinforeces some of the climate concepts we learned in class.

Tropical reforestation, though, is still a win-win situation.

Friday, December 02, 2005

And you thought I was kidding about cow flatulence....


Hey guys, remember when I was talking about methanogens in livestock being an important source of geenhouse gasses? Well, a student in the class just sent me an article about work being done to reduce the amount of methane a cow emits. Glorious work that would make your family proud, to be sure.

Also, you have an article assigned for the test by Jackson et al. called "What was natural in the coastal oceans" that talks about changes in the oceanic ecosystem, and a larger issue about what we should use as ecological baselines. The article is on the blackboard site, and there will be a general question about it on the final.

An article out today talks about fisheries bycatch and how that affects oceanic fish populations. Again, sent in by a student.

Tuesday, November 29, 2005

I have what living in my intestines?

You'll never think of yourself the same way again after reading this Science article on the gut. Check out the issue in general--it has some great information in there. There is also the article on Arctic Foxes, seabirds, and vegetation on the Aleutian Islands that is an excellent example of top-down effects.

Ecosystem Ecology and Remote Sensing

Hey guys, I thought you might find some of these remote sensing links interesting. They compliment the material on ecosystem ecology and biogeochemistry. The first is one we'll see in class that shows oceanic NPP and a bunch of other interesting ocean sites (here too).

If you're interested in radiation budgets, there are some amazing images and data available at the University of Maryland site.

Also, check out more information on intercontinental dust transport.

Monday, November 14, 2005

Do not adjust your set. We are in control.


Some students have gotten back to me after the lecture on predation and parasitism and were asking how parasites can control host behavior, and apparently so precisely. The short answer is that we have no clue. We know that parasites can make neuropeptides that have stronger effects on their target receptors than the host's own neuropeptides, but it is a long way from dosing the brain with neuropeptides or neurotransmitter mimics to getting a response that at least appears to be ordered. Simple brain damage seems wanting as an explanation as well, unless the parasites have chosen precisely the correct areas of the brain to damage.

In the rat-cat example, Toxoplasma gondii takes over the rat's interface with the world--the way sensory input is processed in the brain--and co-opts it for its own use in a way that decreases the rat's fitness. In the language of evolutionary biologists, that is a big bummer. Carl Zimmer is a writer for Science and has a great overview of the original rat experiment, and the general theme of parasites modifying your behavior.

The Dingo


We're starting to talk about species interactions in lab this week and I thought I'd put up some information to supplement the lecture. First, check out the Dingo and information about the Dingo Fence we talked about.

Wednesday, November 09, 2005

Competition links

Hey guys, I thought that I might start putting a few links up here that give background on the material covered in lecture. Feel free to add your favorite links by commenting on the post! Here are a few links from the rocky intertidal zone. There are good pictures and explanation at this site, and other great sites:
http://www.habitat.adfg.state.ak.us/geninfo/kbrr/coolkbayinfo/kbec_cd/html/ecosys/estuarin/rocky.htm

http://hmsc.oregonstate.edu/projects/rocky/tidepool.html

If you want more information about Caribbean Anoles and Anolis in general, look no further than Jonathan Losos' lab page.

And, of course, let's not forget the Darwin's Finch radiation!

Tuesday, November 08, 2005

The latest from NASA

Hey guys, I thought this set of links from NASA would help you gear up for next week's lab. Take a look at some of the things happening on your planet.

The latest from NASA's Earth Observatory (08 November 2005)
------------------------------------------------------------------------


New Features:

* Looking for Lawns
Move over, corn. According to a satellite-based estimate, lawns constitute the largest area of irrigated crops in America.

* Drought and Deluge Change Chesapeake Bay Biology
Although the Chesapeake Bay appears serene at the water's surface, changes in the surrounding landscape threaten the complex ecosystem.

--------------------

In the News:

* Latest Images:
Dust Storm off Alaska

Thick Smog over Beijing, China

Rosario, Argentina

Lava at Sierra Negra Summit

Vodlozero National Park

Lake Nasser, Egypt

Warm Waters in the Chesapeake

Landslides in Northern Pakistan

* Media Alerts
- ERS Altimeter Survey Shows Growth of Greenland Ice Sheet Interior
- Western States to Host First Test of Carbon Sequestration in Lava Rock
- Odd Energy Mechanism in Bacteria Analyzed
- Asleep in the Deep: Model Helps Assess Ocean-Injection Strategy for Combating Greenhouse Effect
- Modeling of Long-Term Fossil Fuel Consumption Shows 14.5 Degree Hike in Temperature
- Microfossils Show Promise in Prospecting Climate History
- California's Oak Woodlands Face a New Threat: Climate Change

* Headlines from the press, radio, and television:
- At Least 22 Dead After Indiana, Kentucky Tornado
- Big Meteor Shower Puts on Show in Alaska
- California Goats Scarf up Wildfire Threat
- Japan to Launch Quake Warning System Next Year
- Ship Canal Was Storm Funnel during Katrina
- Global Warming Could Help Salmon in Norway
- Huge Iceberg Breaks Apart in Antarctica
- Katrina and Rita Ripped up Huge Chunk of Louisiana's Coastal Marshes
- Mexico Coral Reef Set Back 100 Years by Wilma
- Volcanoes Help Maintain Ocean Levels
- Expanding Desert Could Cover China's Breadbasket with Sand
- Climate Response Risks to Nature
- Dramatic Weather Changes Due to Human Activity, Climate Change
- Climate Change Linked to Rise in Malaria, Asthma
- Caribbean Reefs Bleached by Warm Water
- State Tornado Numbers Take an Upward Turn
- Levee Repairs May Not Protect New Orleans
- Typhoon Kai-Tak Batters Vietnam Coast, 15 die
- Pakistan Quake Toll Leaps to More than 73,000
- Dire Future if Fossil Fuel Use Not Curbed, Scientists Say
- California Quake Could Devastate Water Supply
- Great Salt Lake May Return to Normal Level
- October Sets Rainfall Records in Northeast
- Hurricane Forecasting Gets Budget Boost
- Military Wants the Weather on Its Side

* New Research Highlights

Monday, November 07, 2005

Out of the frying pan, into the diesel

Hey all, I don't want to distract you from the rest of the stuff on the blog, but check out this article in the Winston-Salem Journal about the biodiesel effort that Dr Anderson told you about. Here is another web site where you can get more information about the effort too. Make sure to get Google Earth running on your computers--there is a post further down the blog that gives you a lot of information on it.

Friday, November 04, 2005

Birds!


Hey guys, you can run, but you can't hide from the blog! Check out this cool bird site from Cornell University. I remember being surprised by how many people in the T-Th class were birders, so I thought you might want to check this site out too. If any of you are interested, we're going to be netting and banding birds starting in the next few weeks. If you want to get involved, check out this banding information and tutorial at the Patuxent site, and the amazing set of links at this person's web site--she's a bigger geek than I am!

If bird-banding sounds like fun, come on out and band a few with us. If you're good at it we might even be able to get you a job in the Andes of Peru, or down in the Galapagos.

Google Earth

Hey all, we're going to start talking about ecological and evolutionary processes that occur on large spatial and temporal scales. Two of the tools we biologists use to look at these are called Geographical Information Systems (GIS) and Remote Sensing. We're the first generation that has access to tools that lets us monitor the entire globe--from ocean temperatures to cloud cover to terrestrial and oceanic primary productivity to forest cover change--and use these tools to answer scientific questions.

GIS and Remote Sensing used to be the realm of techno-shaman like Sassan Saatchi at the Jet Propoulsion Laboratory in Pasadena. (His work on African and Neotropical forests is amazing.) Not anymore. A free version of Google Earth (GE) is available online and has democratized remote sensing and GIS so that even first-timers can ask global-scale questions about remotely sensed data, and also archive data in ways that clearly communicate this to others. For example, the global spread of Avian flu is being monitored using Google Earth, and GE is also being used to aid the earthquake relief effort in Pakistan. There is a great blog that you can use to see some of the uses of Google Earth. The blog also has tips about setting up Google Earth for maximum utility.

After you get Google Earth set up, click this link and open the folders under your "places" and start double clicking on these African animal photos take on Michael Fay's African Megatransect.

And, blow your mind with the geological tours at this site. Tons of great information on how the earth works. It has tons of remote sensing covering mountain ranges, the Tsunami, Hurricane Katrina, earthquakes, etc.

Friday, October 28, 2005

Watch the skies--more migration

Hey guys, the migration is on again tonight, and you can see it starting in the east and working its way west. It starts about 1.5 hrs after sunset. There is a giant flock of birds heading south from Chicago right now. Check the base reflectivity loop for Springfield Ill--you can see the flocks flying south.

Here is a paper from Sidney Gauthreaux at Cornell that gives a popular account of using NEXRAD to track birds. It tells you all about what the radar is showing. There are a lot of publications about hawk migration, etc., that he has PDF for that can be found here. Dr. Zeyl appears to be joining the Geek Squad. He's busy crunching migration numbers at this moment. Take some time to look at this. It is really fun!